This blog is primarily done to learn ways to diagnose memory leaks on running JVM instances. I will tackle this with the most commonly used tool which is VisualVM.
Note that the document is probably not in a complete state since I am still learning new ways that leaks can occur and be detected.
The project used to analyze memory leaking can be found on GitHub.
VisualVM is a free and open source tool that provides a visual interface for viewing detailed information about Java technology-based applications (Java applications) while they are running on a Java Virtual Machine (JVM).
VisualVM organizes data about the JVM software that is retrieved by the Java Development Kit (JDK) tools and presents the information in a way that enables you to quickly view data on multiple Java applications. You can view data on local applications and applications that are running on remote hosts. You can also capture data about JVM software instances and save the data to your local system, and view the data later or share the data with others.
More on VisualVM can be found on their site.
A Memory Leak is a situation where there are objects present in the heap that are no longer used, but the garbage collector is unable to remove them from memory, and therefore, they’re unnecessarily maintained. If not dealt with, the application will eventually exhaust its resources, finally terminating with a fatal java.lang.OutOfMemoryError.
Memory leaks can occur due to a multitude of reasons. For example static Lists which (since they are static) never get dereferenced and keep increasing elements, unless of course you dereference them by setting them as null (destroying) them. Other common leak sources:
Checking for a memory leak can be done by browsing a heap dump. Either live when the leak occurs rapidly or slowly over a period of time if the leak occurs incrementally (which is the worst thing you can have, due to the amount of time you waste to detect it).
A heap dump is a snapshot of all the objects in the Java Virtual Machine (JVM) heap at a certain point in time. The JVM software allocates memory for objects from the heap for all class instances and arrays.
The garbage collector reclaims the heap memory when an object is no longer needed and there are no references to the object. By examining the heap you can locate where objects are created and find the references to those objects in the source.
You can use VisualVM to browse the contents of a heap dump file and quickly see the allocated objects in the heap.
While trying to diagnose a memory leak it is wise to include these JVM arguments when starting the application:
-XX:+HeapDumpOnOutOfMemoryError
-XX:HeapDumpPath=/path/to/dumps
-verbose:gc
-Xloggc:gc_%t.log
Parameters explained:
-XX:+HeapDumpOnOutOfMemoryError Automatically generates a heap dump when an java.lang.OutOfMemoryError exception occurs. This is invaluable because you capture the exact state that caused the failure.-XX:HeapDumpPath=/path/to/dumps Specifies where heap dumps should be saved. Use an absolute path with sufficient disk space (heap dumps can be large)-verbose:gc Enables basic garbage collection logging to standard output. Shows when collections occur and how long they take. Helps identify if GC is running frequently but unable to reclaim memory.-Xlog:gc:gc_%t.log Directs GC logs to a specific file instead of STDOUT. Using the %t we avid log rotation and new logs overwriting old ones.Lastly in heap dumps you may come across dominator trees. These are extremely useful when detecting a memory leak. In memory analysis, object A "dominates" object B if all paths from the GC roots to B must pass through A. This means:
The dominator tree organizes objects hierarchically based on this relationship, making it easier to see which objects are responsible for keeping large portions of memory alive. They help identify:
An example pattern (deduced from a dominator tree):
HashMap) might appear high in the treeOnce you have your heap dump it is time to detect the irregularities. To check for irregularities you first need to know how your application should operate when there are none. For example what is the appropriate number of loaded instances for the low and peek hours.
Once you know what your normal base of operations is you can start to look for irregularities. If you for example have total of 32k String instances during low hours and currently VisualVM is displaying 50k there could be a potential issue that was introduced in the latest patch/version of your software.
In cases when memory slowly increases the best thing is to take application snapshots and heap dumps every X amount of time. That can be hours/day/weeks. But usually it is either every 4/8/12 hours or once a day. After a couple of snapshots you can start to check for what is increasing above what you would consider an appropriate amount (the base).
If you run the Memory Leak Example project and activate the VisualVM monitoring tool you may observe the LEAK list slowly increasing in size. Take a heap dump every 30 minutes, and you will see that the number of retained String instances inside the ArrayList is steadily growing. This is one of the more common occurrences that produce memory leaks.
After you try the application without hard limits for the JVM it is time to force a java.lang.OutOfMemoryError, therefore run the application with these parameters:
java -jar -Xms3m -Xmx3m \
	-XX:+HeapDumpOnOutOfMemoryError \
	-XX:HeapDumpPath=./dumps \
	-verbose:gc \
	-Xlog:gc:./gc-logs/gc_%t.log \
	memory-leak-example-1.0-SNAPSHOT.jar
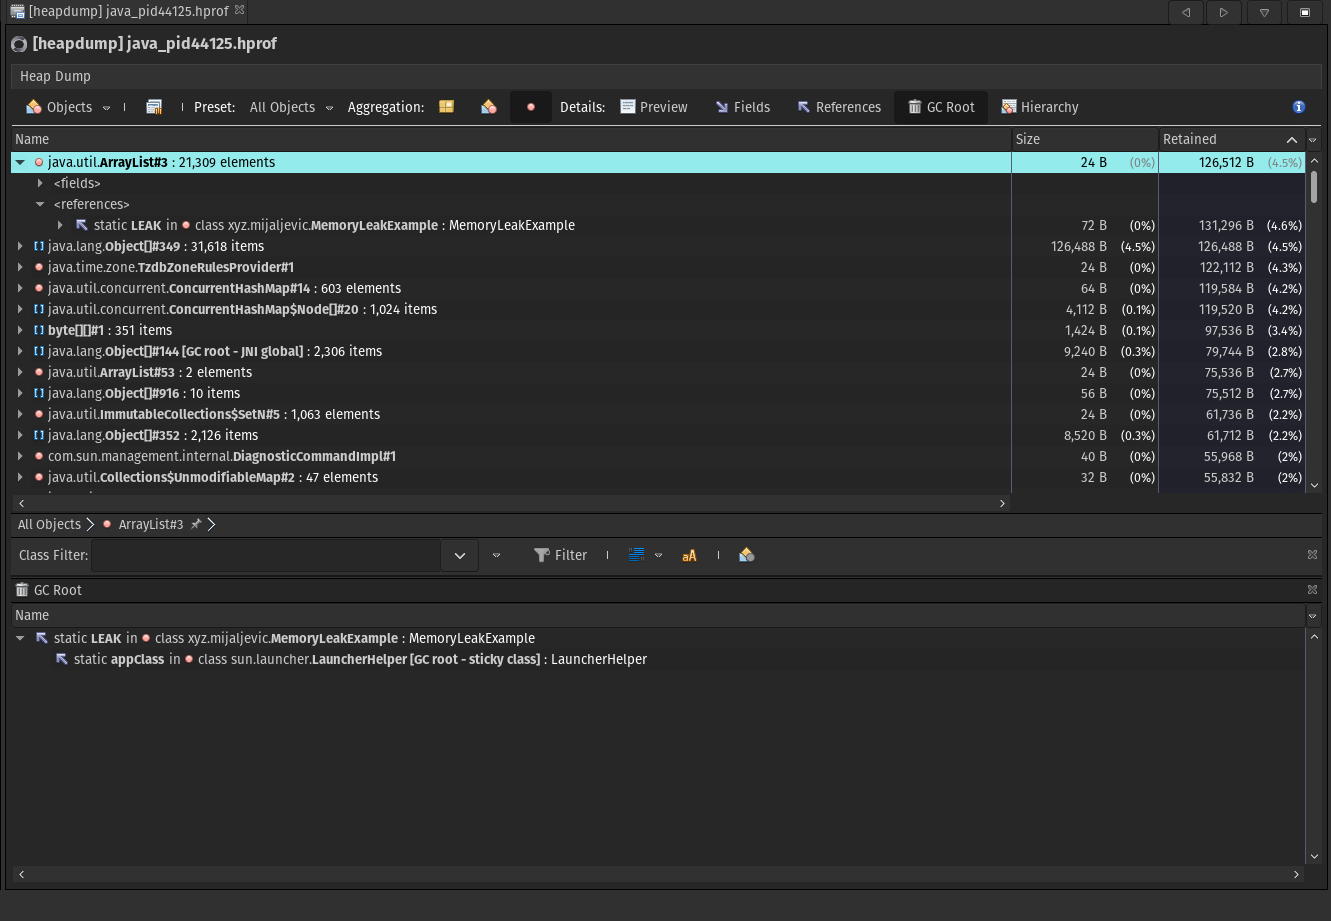
This will induce a java.lang.OutOfMemoryError at 3Mb of heap space and generate the heap dump which you can then read using VisualVM. After some time a heap dump will occur (if you try to attach a profiler while the app is running you will get one even sooner). In the image bellow you can observe the dump that was produced by the OutOfMemoryError exception.
As you can see it is caused by the static list "LEEK" we have created to showcase the memory leak.